Monitoring Production from A to Z, this is your CrashPlan
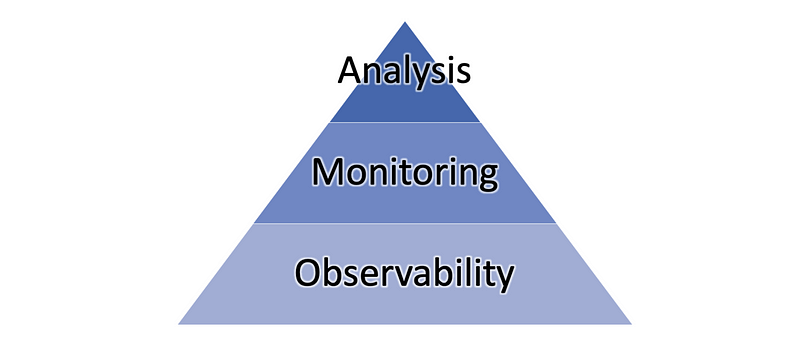
Your monitoring plan can be split into three major parts:

Your monitoring plan can be split into three major parts:
1- Observability Observability enables us to collect all logs and events and behaviors of the servers.
2- Monitoring provides feedback from production and delivers information about an application’s performance and usage patterns, such as :
- Tells you whether the system works
- A collection of metrics and logs about a system
- Failure-centric
- Is “the how” / Something you do
3- Observability
- Lets you ask why it’s not working
- The dissemination of information from that system
- Understands system behavior regardless of an outage
- Is “the goal” / Something you have
- You make yourself observable
Observability vs Monitoring? clear the confusion

Let’s make our hands dirty
Let’s make the CrashPlan for monitoring a company called ‘test’
Imagine that we have a running website, that has multiple services, each service is hosted with a different subdomain.
The complete schema for the company is the following:
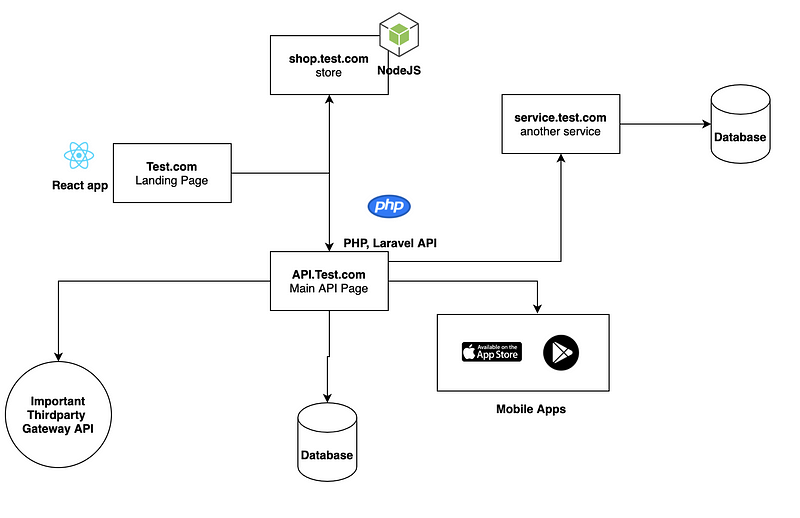
To achieve perfect monitoring, we need to list down all the dependencies:
the store and service.test.com and the landing page and the mobile apps depend on the API.service.com (4 dependencies)
The API.service.com depends on the 3rd Party API.
So, It means that we have 2 important crash points, or specifically we call it Single Point of Failure.
Unfortunately, we cannot change the structure of the company, but we need to provide good monitoring and alerting in order to increase the availability percentage of the service.
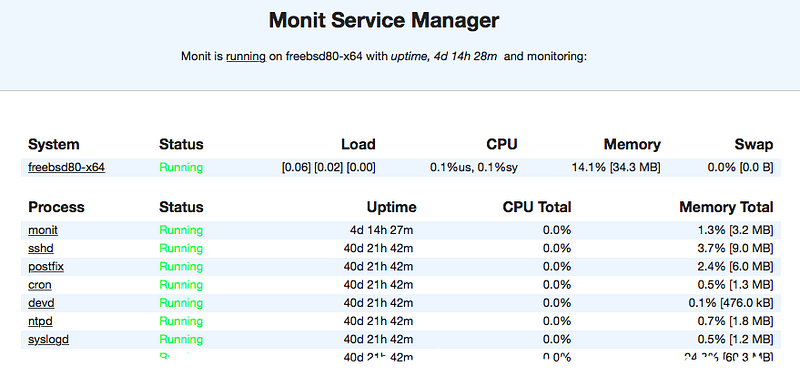
— Monitoring with Monit:
Monit is a utility for managing and monitoring processes, programs, files, directories, and filesystems on a Unix system.
Monit is running in daemon mode, it is configured by cycles which is a polling interval in seconds.
In our example, we are defining 1 cycle = 5 seconds
A few Monit Rules, that can be very helpful:
- Loadavg (15min) > vCPU x for 12 cycles
- CPU usage > 90% for 12 cycles
- Memory usage > 75% for 12 cycles
- Uptime > 90 days
- Disk usage > 80%
- Disk usage > 90%
- DB Service should be UP for 1 cycles
- SSH Service should be UP (Port 22) for 6 cycles
- Monitor Login page by simulating HTTP Requests to the API (and Expect a status code of 200 or raise an alert)
- Monitor reachability of all critical endpoints monitor the page speed load
- Monitor the SSL Validity should be treated for 2 weeks, which gives you some time to breathe and plan for an SSL upgrade.
- Monitor the Latency between different components running.
- Monitor all the external and 3rd Party endpoints
Once an alert is detected, a trigger should be fired to inform the Ops team :
Rules triggers
- The alert should be recorded for reference on Alerta Dashboard with the correspondent severity level.
- A slack notification should be sent to a Slack Channel/ Discord/ email. etc
Please find the complete documentation of Monit here: https://mmonit.com/monit/documentation/monit.html

Please find the complete documentation of Alerta here:
https://docs.alerta.io/en/latest/
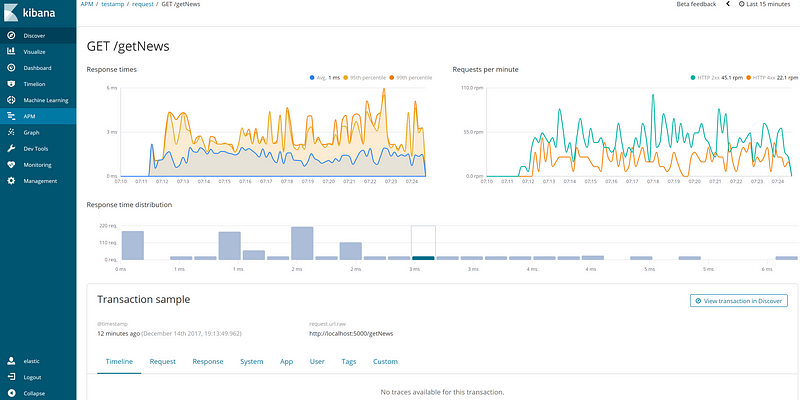
— Monitoring performance Elastic APM :
An APM is required to install it on the API and the shop and the other service to monitor, detect, and diagnose complex application performance issues to maintain an expected level of service
- Provide visibility
- Identify root causes
- Maintain service levels
- Scale with growth
Elastic APM is available for most of the languages :
- APM Go Agent [1.x] — other versions
- APM iOS Agent [0.x] — other versions
- APM Java Agent [1.x] — other versions
- APM .NET Agent [1.11] — other versions
- APM Node.js Agent [3.x] — other versions
- APM PHP Agent [1.x] — other versions
- APM Python Agent [6.x] — other versions
- APM Ruby Agent [4.x] — other versions
- APM Real User Monitoring JavaScript Agent [5.x] — other versions
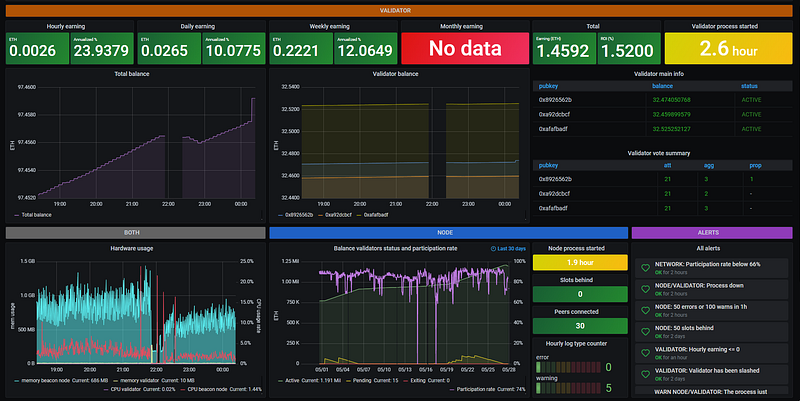
— Server Metrics with TICK Stack :
We use telegraf to have a minimal memory footprint of the hardware metrics for upcoming debugging.
We use influx DB, a time series DB to store all the real-time metrics,
We use Grafana to visualize all the data and create wonderful Dashboards
Full documentation for telegraf : https://www.influxdata.com/time-series-platform/telegraf/
Full documentation for influxDB:
https://docs.influxdata.com/influxdb/v2.0/
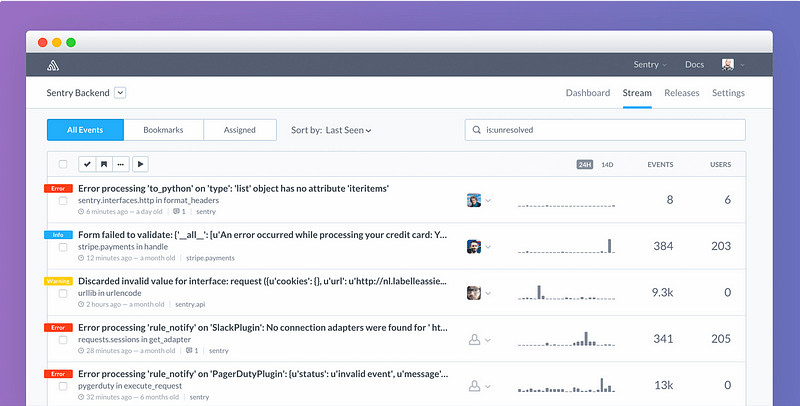
— Error reporting with Sentry:
Sentry is cross-platform application monitoring, with a focus on error reporting.
Where you can track errors on the running apps of your production and resolve by pushing new releases as soon as they happen.
I highly recommend deploying the self-hosted version of sentry because it’s free and easy to deploy.
Full documentation: https://develop.sentry.dev/self-hosted/
I hope that I came across all the pain points of monitoring, alerting, and Observability.
If you have any questions or you need more details, please feel free to contact me at [email protected]